Fixed income securities are often the most misunderstood investment class among personal investors. Very few individuals were taught what it truly means to be a bond-holder and what type of risks are embedded in fixed income securities. Due to some feedback regarding my previous post about high-grade corporate bonds looking attractive, I am going to make a strong attempt in explaining the basics so that we can all make better investment decisions.
Fixed income securities (A.K.A Bonds) are usually securities that pay a fixed rate over the life of the security. The simplest structures are coupon and zero coupon bonds. A coupon bond pays a percentage of the principal at periodic times, usually semi-annually. So if you buy a $100,000 of a 6% coupon bond you receive .06/2*100,000=$3,000 every 6 months. If instead you bought a zero coupon bond, the price of the bond would go up as interest accrues until maturity. The difference is just in the timing of the interest payments, coupon bonds receive payments in cash periodically while zero-coupon bonds do not.
The key in understanding fixed income comes in breaking down the yield of the bond. Thirty year government bonds pay a little bit over 4% today. There are 4 reasons that the government pays you 4% to buy a government securities:
- Real risk free rate – think of this as just the general cost of borrowing, usually using a 3-Month T-Bill rate
- inflation premium – paid to cover the future expectations of inflation
- liquidity premium – payment for buying something that is not easily sold (usually small, especially for treasuries)
- maturity premium – payment for locking up your money for 30 years and the risk that interest rates will change drastically before your maturity
For investors that are not exclusively investing in risk-free treasury securities there is the final and most important factor: the credit risk premium. The credit risk premium pays you for the risk that a specific issuer (say Alcoa) will default. If an issuer defaults, it means that they are unable or unwilling to fully satisfy the terms of your bond contract and you receive less than the coupon payments and principal payment back. This extra payment for the riskiness of the underlying issuer is known as the credit spread. A company that has a lot of default risk will have a very large or wide credit spread whereas a low-risk company will have a narrow credit spread. Credit spreads can be quoted against the treasury curve or against the LIBOR (London Interbank Offering Rate) swap curve. LIBOR is more often used in modern times because it is the underlying interest rates for which all derivative contracts in the United States trade.
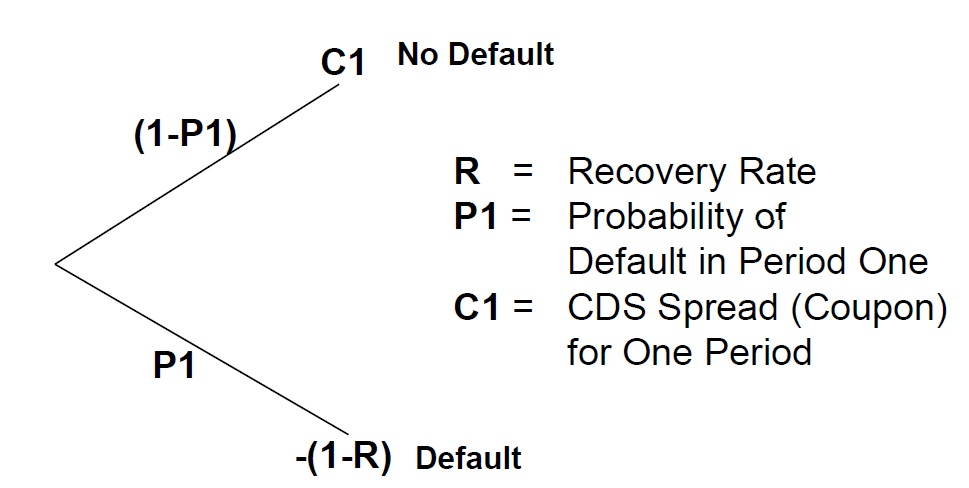
Instead of continuing to talk about the lingo, I think it is more helpful to present an example. Treasury securities with a maturity of 1 year currently trade at about .4% or 40bps. Monsanto, the very large agricultural company, has 1 year bonds that trade at 1.15%. That implies that the credit spread to treasuries is currently (1.15%-.4%)=.75%. That 75 bps represents the extra default probability of Monsanto over the next year. Credit default swaps are transactions that only trade credit risk which is represented by the credit spread. In the derivatives world, trades are referenced against LIBOR and not treasuries because the trades occur between non-government run private banks with an average credit rating of AA (more risky than the US government). So instead of .75%, the spread to LIBOR is .52% , the difference between the 75bps and the 52bps is due to the risk spread between bank funding levels (LIBOR) and government funding levels (treasuries). In this example, let us visualize an outcome for Monsanto over one year:

If you insured someone against the default of Monsanto over one year, in the top case if Monsanto did not default you received C1(.52%) and in the case Monsanto defaulted you paid out 1 minus the recover rate. Assuming a recovery rate on the bond of 40%, you paid out 60% or .6
In order for the 1 year Monsanto credit default swap trade to not have any value on the date that the trade is entered, the top node must equal the bottom node. Ignoring interest rates this means that at time t=1 year:
Spoken in English, this equation means that the coupon payment at year one will be received as long as the company survives (1-P1) and that coupon payment must equal the payout if they default times the probability of default P1 in order for the contract to be zero at time zero. Why does the contract need to be zero? Because that is where the market is pricing the credit risk of Monsanto today, when the trade occurs. If the seller of protection thought there was a higher default risk in Monsanto, then the traded spread would be higher – say at 60bps instead of 52 bps.
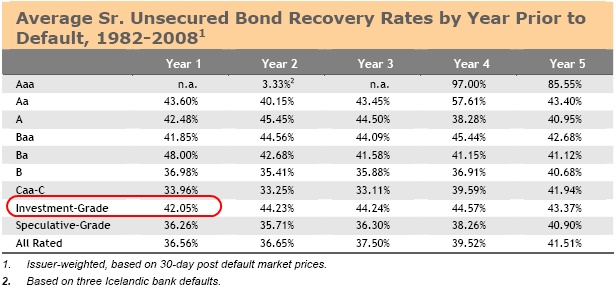
We end up with one equation and two unknowns, something that is impossible to solve. In the financial world we begin making assumptions and it is easier to figure out the value of the bond after the company defaults because we have historical data. We can become as granular as the data allows by breaking this down by industry and by credit ratings, e.g. the historical recovery rate of all BB companies in the energy sector. In this example, I am going to use a broader dataset by looking at Moody’s historical investment-grade recovery rate average for the 1982-2008 year period shown below.
Now that we have a recovery rate assumption, we can solve for the 1 year market implied default probability for Monsanto:
Now of course this is a simplified example with some holes in the underlying theory. The first, most glaring problem is that this does not use continuous mathematics. In reality, Monsanto can default on any day from the time the trade is put on to 365 days later. In addition the coupons are received quarterly and are accrued daily. A way to at least roughly put this equation into a continuous time frame is:
Even if this is a simplified explanation, at least now you can begin looking at bonds as portraying a probability of default and not just as a yield. It is much easier to make the statement, “I do not believe Alcoa has a 25% probability of defaulting during the next 5 years” rather than saying, ” a 250 bps swap spread seems much too wide for Alcoa”.
The confusion starts when people are talking about yield exclusively when referring to bonds. Yield levels do not tell you whether a bond is trading at a cheap or rich valuation, but the spread between the company’s yield and a treasury of the same maturity does. Interest rates should be managed separately from fixed income portfolios in order to maximize long-term returns. Interest rates can be easily hedged, but credit spreads cannot. This misconception is a big reason that investors are jumping for high yield bonds rather than investment grade bonds. Underlying interest rates are low, giving the impression that investment grade bonds are trading at rich levels and high yield bonds are trading at cheap levels. I think the reverse is true, so do not let interest rates fool you too.
The grids below show the market implied default probabilities for 1 year and 5 year bonds respectively given different recovery rate and spread levels:


