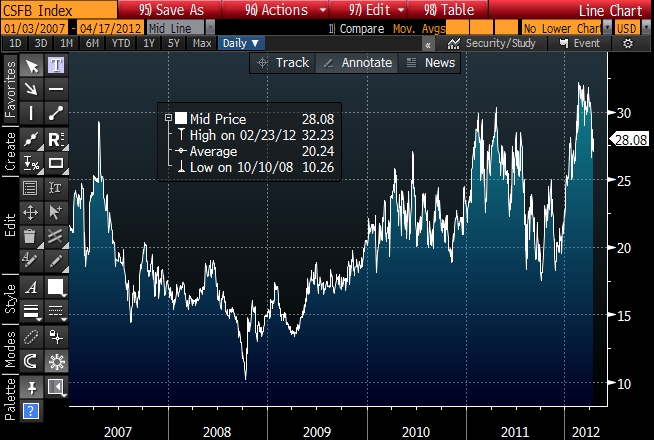
It was interesting to watch the Credit Suisse Fear Barometer rise from the low 20’s in December to an all time high of almost 32 in late February. If you do not remember, the CS Fear Barometer measures “fear” built into implied volatility skew by looking at zero cost collars on the S&P 500. The index assumes that you sell a 3-month, 10% out of the money call and use the proceeds to purchase a 3-month out of the money put. The moneyness of the put option that you can afford is the index itself, so if the index is at 25 it implies that you can purchase a 3-month put 25% out of the money with the premium that you received from selling the 10% OTM 3 month call.
Since index inception in November of 1994, this average level has been 16.9%. With the market turbulence of the last five years, the average has been closer to 20%:
I talked about this index in April 2011 and I am mentioning it again in April 2012. “It certainly does not give me a comfortable backdrop for being overly bullish.”


