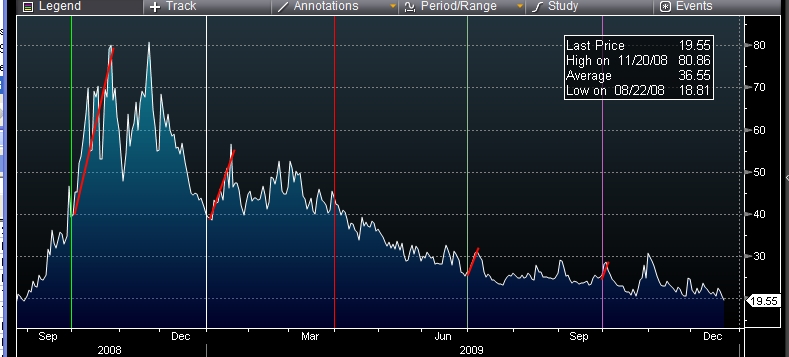
The end of the year seems to lend itself to a bit of a conspiracy theory. My focus today is on the VIX, but with the backdrop of financial statement marks at quarter–end periods. Everyone knows that year–end results weigh heavy on financial institutions (and the bankers’ yearly bonuses). It is my opinion that the year–end marks are so material, that the markets are manipulated to make the results look better. My first example looks at the VIX trajectory over the last few months. I understand that the S&P is near its highs (which would be manipulated as well to post better than expected results), but it seems rather convenient that the end of the year just happens to mark the lowest levels in the VIX since August 2008.
My theory is most pronounced in the middle of the crisis. On September 30, 2008 (post Lehman collapse) the VIX was historically high at 40%, but no where near its peak of over 80% Likewise, the VIX collapsed between its highs intra-4th quarter and ended nearly where it started the quarter on December 31, 2008 at 40% again!
You might ask why the banks care if the VIX is low at quarter-end. The reason is because banks are net option sellers. They cannot lay off all of the risk that they take on their balance sheet, so they warehouse a lot of it because there is way too much demand from insurance companies and institutional option buyers that are hedging their risks.
And what about the biggest derivatives behemoth of them all? The interest rate swap market. Pension funds, insurance companies, and other institutions are the net buyers in this arena. They mostly gain interest rate exposure to neutralize their liabilities by going long interest rate swaps. This exposure is most desirable on the long end of the curve at 20+ years because that is where a lot of insurance and pension payouts reside. Where does that place the banks? You guessed it, net short interest rate swaps. For the strangest reason, 30 year swap spreads have been negative intra-quarter since November 2008. This does not make sense because it means that a risky investment bank is paying a lower interest rate to its counterparty than the US government pays for the same privilege.
The 30 year swap spread going from -60bps on November 20, 2008 to +10bps on December 31, 2008 seems the most suspect to me. Especially when the spread fell back below -20bps soon afterward.
If you do not understand why the banks would want swap spreads negative intramonth and higher at quarter ends, think of it this way: they have contracts with other financial institutions saying that they will pay less than treasuries so when that swap spread move up from where they struck the contractual rate, they have immediate gains on those contracts.
And it seems like it is happening all over again this year…


