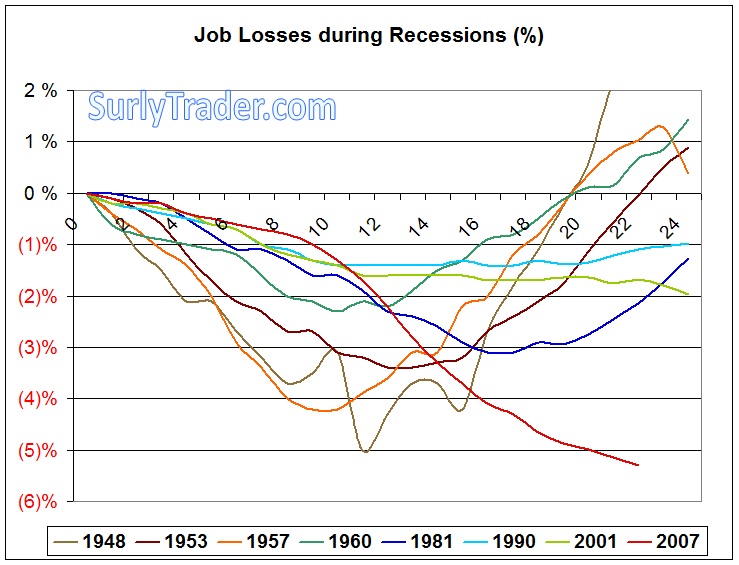
The media most often cites the U3 labor statistic as it is considered the “official” unemployment gauge. The latest reading came in at 10.2% an is quickly encroaching on the all time recorded U3 high of 10.8% set in 1982. Unlike U3, U6 unemployment levels are a more complete and broad picture of unemployment in the United States. U6 includes U3, plus discouraged workers, those working part time who want a full time position, plus marginally attached workers. U6 unemployment levels currently reside at 17.5%
Unfortunately, the official bureau of labor statistics data only goes back to 1948, so we are unable to make comparisons to great depression unemployment levels. The good news is that someone has already spent the time to estimate what U3 and U6 unemployment data would look like during the Great Depression. Nelson Andrews estimates that in 1933 U6 peaked at over 37% and U3 peaked at over 25%.
So we can all let out a sigh of relief that our current unemployment predicament is not anywhere near the pain level that was felt during the great depression. On the flip side, the loss of jobs since the beginning of this recession has been more dramatic than during any recession since 1948.
What is even less promising are economists’ view that job losses will continue well into 2010 and possibly remain in the double digits for multiple years. We have found that those who have lost their jobs have had an incredibly difficult time finding replacement jobs. The exhaustion rate has recently hit an all time recorded high (since 1972) of 52.41%. This means that 52.41% of those who are laid off run out of unemployment benefits before finding another job.
This seems to be a terrible trend that has been getting progressively worse with the decline of American manufacturing and industrial businesses. It is rather hard for most people to pay their bills when they have been unemployed for over 6 months…
[Download not found]


