Portfolio diversification is at the heart of modern portfolio theory. Nobel Price laureate Harry Markowitz said, “Diversification is the only free lunch”. There are two primary ways to achieve investment diversification in a portfolio. The first is to pick more than one stock or bond. The old rule of thumb is that if you buy about 30 individual stocks you can create a “diversified” equity investment portfolio by reducing the amount of idiosyncratic risks (individual company risks) and leaving you with systemic risks (general broad market risks). Charlie Munger from Berkshire Hathaway would argue that stock diversification leaves you with mediocre returns, but we will leave stock picking as another topic for discussion.
The second way to diversify your portfolio is to diversify among asset classes. In the broader context, the main asset classes are public equities, private equities, fixed income and real assets. The onion can be continuously pealed with more narrow “asset classes” such as breaking apart public equities into sectors such as cyclical, non-cyclical, technology, utilities etc. Likewise, you could break apart fixed income into treasuries, investment grade corporate bonds, securitized fixed income, high yield bonds, etc. The definitions of specific asset classes are arguable, but the theme is consistent. For this discussion, we will only focus on equity and fixed income as they are the dominant asset classes in any portfolio construct and will contribute the most impact to any return and risk outcome for a portfolio.
For this analysis we will focus on two of the most followed indices in the financial markets – the S&P 500 Total Return Index (S&P 500) and the Bloomberg Barclays Aggregate US Fixed Income Total Return Index (US Aggregate Bond).
If we look at the long term geometric annual return of the S&P 500 on a total return basis it is quite impressive at 10.7% from the beginning of 1989 through June 2023. This phenomenal return is accompanied by its risk with annual volatility of returns being 18.1%. This metric implies (given a normal distribution of returns which is never true) that about 67% of the time the annual return will be +/- 18% of the annual average return. This is a good metric for describing stock return “noise”, but a more deeply painful metric is what investors experience from peak price to trough price in a large equity market sell-off. For the S&P 500 during this ~25 year period we experienced that with the Great Financial Crisis between 2007 and 2009. During that period, the S&P 500 sold off by more than 55%:
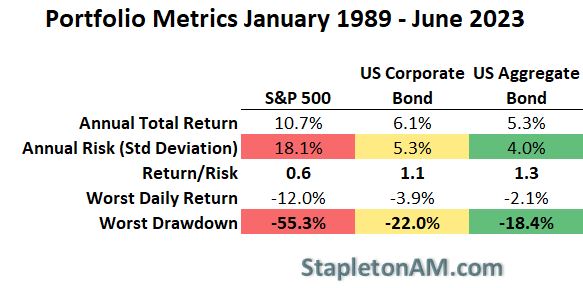
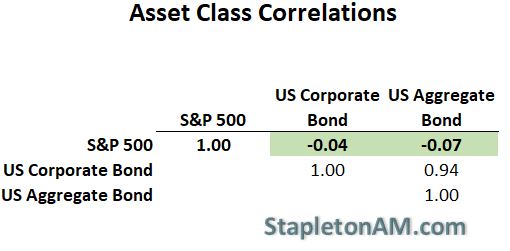
This period was also a strong return period for fixed income as interest rates predominantly dropped during the period. The annual return was not nearly as strong for the Bloomberg Barclays aggregate at 5.3%, but the risk was much smaller with only 4% volatility and a drawdown of -18.4%. It is not only the reduction in risk or volatility that makes fixed income such a great diversifier for equities, but also because its returns generally move in opposite or uncorrelated ways with the equity markets. If you look at the same period and measure the correlation of daily returns, you can see that the Bloomberg Barclays Aggregate has a -.07 correlation with the S&P 500:
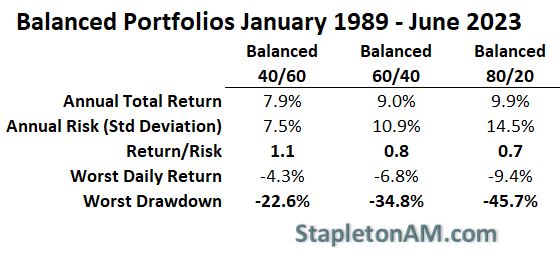
With this as a backdrop it makes perfect sense to look at mixed allocations of equities with fixed income. Many financial advisors use a moderate allocation for most clients which targets a 60% allocation to equities and 40% allocation to fixed income. As you can see below, this has produced a strong annual return of 9% with a volatility or risk metric of 10.9%. In context, the 60/40 balanced portfolio has captured 84% of the S&P 500’s return while maintaining only about 60% of the risk as measured by volatility or standard deviation:
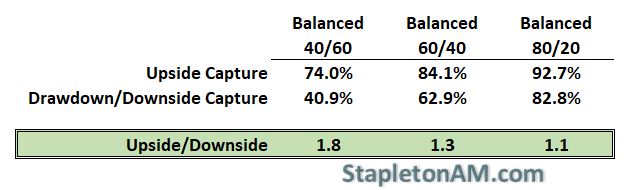
Lastly, it is important to acknowledge that annualized volatility is not the only risk metric that investors should look at. In reality, the most emotional pain is caused by how much your portfolio value is reduced from its peak valuation to its minimum valuation during a strong risk asset sell-off or correction. This is calculated by using the drawdown metric instead of annualized volatility and as you can see, the outperformance on a upside/downside basis stills holds true for balanced portfolios:
The end result is that investors should carefully assess how much risk they are willing to take and adjust the portfolio accordingly. It is great to shoot for strong returns by increasing equity allocations, but we all need to be cognizant of the extra downside risk that is being introduced to the portfolio. When bonds were yielding ~2% per year, many investors moved to equities to increase projected returns. Now that many low risk fixed income investments can yield north of 5%, it is a great time to reassess the risk that is being taken in the investment portfolio.


