If you have read some of my articles regarding the Credit Suisse Fear Barometer or my discussions surrounding skew, then you understand why 10% out of the money puts are often more highly valued than 10% out of the money calls from an implied volatility standpoint. What I would like to look at today is what it means when the gap between implied volatility on the OTM put changes dramatically from the OTM call.
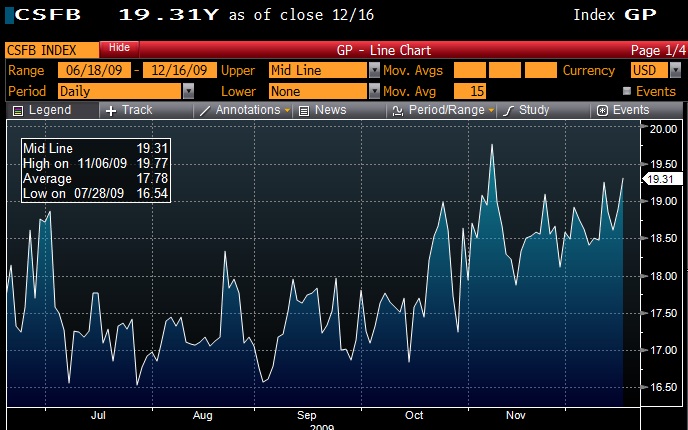
The Credit Suisse Fear Barometer is an easy way to look at the magnitude of skew because it tells you that if you sold a 1 month call option 10% out of the money you could buy an X% out of the money put option. X represents the level of the CS Fear Barometer index. Right now the index is at 19.3%, meaning that out of the money put options are relatively bid up. I wanted to look at what this sort of information could predict about stock prices, so I utilized the option implied volatility levels that I have on the S&P 500 going back to November 2005.
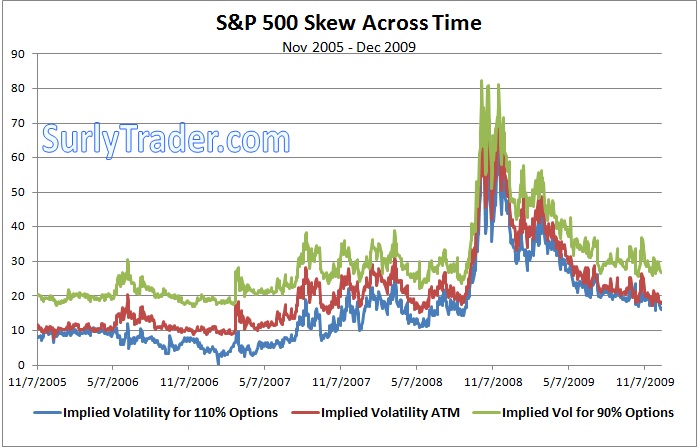
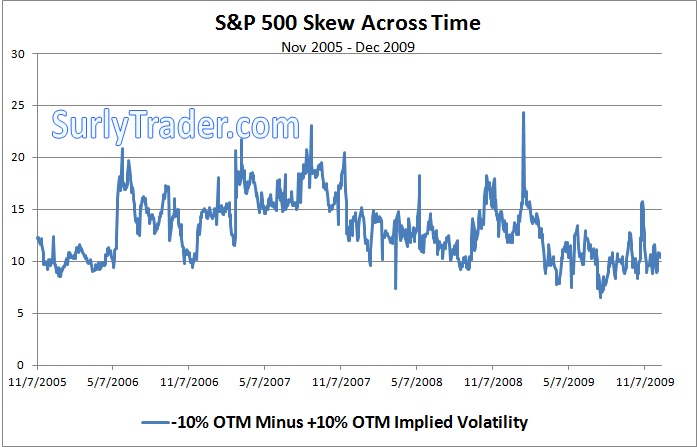
The graph above is interesting not because it shows that out of the money options are traded with higher gap down risk than gap up risk priced in, but that the spread between the two types of risk changes dramatically over time. Put another way, here is a chart of the spread between 10% out of the money upside options and 10% out of the money downside options:
As with all financial time series, the question that comes to mind is what this variation in skew tells the investor over time. The easiest way to look for any information is to perform a simple linear regression on the time series data. In this case, I looked at the predictive power of the skew spread on changes in the S&P 500 over time. We start with a hypothesis: that a high level of skew (generally put options being bid much more aggressively than call options) would indicate that the market is overly scared and we would expect a positive return following a jump in skew. If we do a few simple tests, the results really do not show us much, if any, correlation:
These initial results tell me that the absolute level of skew does not tell me much about the returns on the S&P 500 on the following periods of time across different time intervals. I also checked these results against the daily change on the skew spread with similar outcomes. This is not to say that we cannot find some predictive power here. It is possible that the change in skew over certain time periods has a very predictive power over the S&P 500 over certain lagging time periods. There are an infinite number of combinations that we could try in this example, but I would suggest that this preliminary result does not give me a lot of hope.
On the other hand, it might be that skew is very predictive in the level of future ATM volatility. Meaning that when skew steepens, implied volatility falls over following time periods. I believe this to be true, but that study is left for another day.


