Skip to content


Volatility is all about Liquidity

The S&P 500 tried to pull back yesterday, but as usual the late day trading pushed the loss to just 65 bps.  This has become the normal market.  In 2012, volatility puttered at 12.77%.  In 2013 it fizzled down to 11.07%.  YTD we have crept up to 11.73%.   These metrics tell you to expect daily gains and losses to be +/- .75%.  Very Exciting.

What does this market remind me of?  I would say the nearest example is 2004-2006 when volatility cycled between 10-11%.  What do these two periods in time have in common?  Extremely easy monetary policy provided by the Fed.

The most powerful chart to show you the impact of Fed provided liquidity plots realized volatility against the steepness of the yield curve as measured by the spread between the 10y and 2y treasury rates.  As the fed keeps the front part of the curve low through the Fed Funds rate, the steepness is held high.  A steep yield curve induces investors to borrow at cheap shorter rates and buy riskier assets to earn a spread.  Party on while the Fed provides the punch bowl.

Liquidity and Volatility

The current steepness of the yield curve is a great indicator for future market volatility

The red line above is the steepness inverted, so higher numbers represent the curve flattening or the Fed taking punch away from the party.  Low numbers say party on.  The blue is the trailing 90 day realized volatility of the S&P 500.  When the Fed says to party, the volatility stays abnormally low.

Key point to make in this chart is that the red line is two years behind the blue line so the red line starts at 1/31/1977 while the blue line starts in ’79.   This implies that the tightening of monetary conditions or reduction in market liquidity takes about 2 years time in order for volatility to pick up.  If the curve can remain steep for another two years, then how large will the volatility dislocation become when the Fed does ease off the gas pedal?  Most punch bowls are provided for 2 years or less.  Right now we are in the 6th year of zero interest rate policy with a strong indication that they will maintain it well into 2015.  Maybe this time the volatility will come even before the Fed eases off the pedal?

Posted in Markets, Politics.


Noteworthy News – May 19, 2014

Economy:

Medicine’s Top Earners Are Not the M.D.s – New York Times

Congratulations to Class of 2014, Most Indebted Ever – Wall Street Journal

The State Of The Four Official Recession Indicators – Business Insider

Markets:

UK housing market has deep problems, says BoE’s Carney – Reuters

Asking prices for British homes hit highest on record in May – Reuters

Politics:

Regulatory and academic capture – Washington Post

Want to Do Something About Greenhouse Gas? Try A Carbon Tax – Forbes

Piketty on the U.S.: The birthplace of freedom and progressive taxation – PBS

Banks:

Bonded Bankers – Project Syndicate

59680_cartoon_main-

Posted in Economics, Markets, Media, Politics.


S&P 500/Russell 2000 Spread

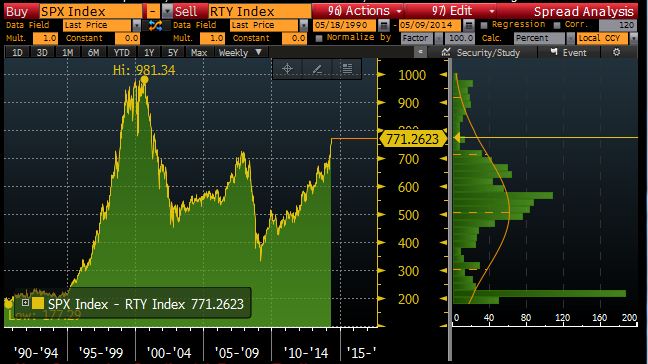
The spread between large cap and small cap stocks is a pretty simple metric, but it is hard to ignore historical correlation to corrections:

Russell SPX Spread

More interesting than the magnitude of the spread is that the Russell 2000 recently broke through its 200 day moving average while the S&P 500 was making new highs:

200 Day moving Average 2014

This same anomaly happened in July of 2007:

200 Day moving Average 2007

Draw your own conclusions.

Posted in Markets, Technical Analysis.

Tagged with , , .


Noteworthy News – May 12, 2014

Economy:

Online tests are the latest gateway to landing a new job – Washington Post

After the crash, we need a revolution in the way we teach economics – Guardian

A Possible Path to Closing the Pay Gap – New York Times

Where Is the Inequality Problem? – Project Syndicate (Rogoff)

Ask yourself, says a notorious ‘Occupy’ academic, should your job exist? – PBS Newshour

Markets:

Mortgage rates defy forecasts – LA Times

Yes, we’re in a tech bubble. Here’s how I know it – CNN Money

I’m worried about a crisis bigger than 2008: Faber – CNBC

Politics:

Pope urges ‘legitimate redistribution’ of wealth – Kansas.com

Fed Chair: ‘Deficits Will Rise to Unsustainable Levels’ – CNSNews

Could take 5-8 years to shrink Fed portfolio: Yellen – Reuters

Banks:

Hedge Fund Moguls’ Pay has the 1% Looking up – Dealbook

59525_cartoon_main

Posted in Economics, Markets, Media, Politics.


Which Market is Right?

I find it rather entertaining when different markets are relaying very different messages.  The 10 year treasury yield ended 2013 with a yield of about 3%.  Today it is at 2.58%.  The Russell 2000 Growth ETF (IWO) is down 11.19% from its early March peak:

Russell and 10Y vs SPY

Is the S&P 500 right while the Russell and 10 Year are wrong?

Do you notice which market is oblivious?  Maybe the S&P 500 (SPY) playing near its all time highs?  Another troubling but related matter: is Vol forever gone?  The VIX has been flirting with the lows of all time:

VIX is Sleeping

VIX has been sleeping for months

The problem is that you start to get that uneasy feeling.  Credit spreads grind tighter while new issue deals are oversubscribed.  Equity volatility remains subdued and the S&P 500 refuses to have any sort of price correction.  You just start wondering if a lack of volatility really forecasts a bright future.  Is the volatility low because everything is fine or is volatility low because “buy on any dip” and leverage up while the money is cheap are the current investment mantras?  Does the latter forecast a massive unwind while everyone runs for the door?

Speaking of leverage, Margin Debt might have something to do with that.  Notice where the peaks occurred?

Margin Debt

Did that balance just peak? What does that mean?


Posted in Markets.

Tagged with , , , .


Copyright © 2009-2013 SurlyTrader DISCLAIMER The commentary on this blog is not meant to be taken as an investment advice. The author is not a registered investment adviser. There is no substitute for your own due diligence. Please be aware that investing is inherently a risky business and if you chose to follow any of the advice on this site, then you are accepting the risks associated with that investment. The Author may have also taken positions in the stocks or investments that are being discussed and the author may change his position at any time without warning.

Yellow Pages for USA and Canada SurlyTrader - Blogged

ypblogs.com