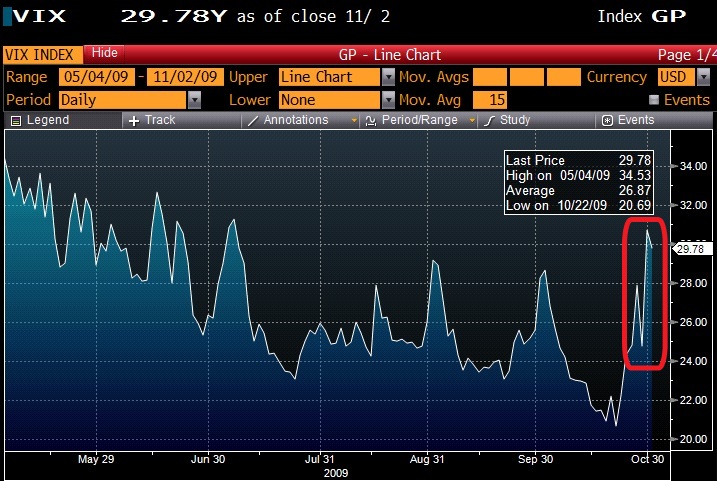
The massive spike in the VIX on the Friday before Halloween got plenty of people spooked and created a slew of questions on whether the over-due correction was looming. Even though I am less than optimistic about the underlying fundamentals of the economy and market valuations, I would like to present a more rational view of why the VIX spiked so strongly on a rather tame (as compared to 4th quarter 2008) -2.8% correction on Friday.
The spot VIX is a calculated value that is derived from the 1st and 2nd month implied volatilities of the S&P 500. A good amount of demand in the institutional space has been on the long (buy) side of the option equation with many firms buying put options to hedge their long equity exposures. The S&P 500 currently has a very strong skew in implied volatilities meaning that downside options have a much higher bid than at-the-money or upside options. What happens in situations like this is that when the market is selling off aggressively, the out of the money options become at-the-money options very quickly and the implied volatilities of what used to be downside options now became at-the-money implied volatilities. You can think of this as riding up the volatility curve much like you can think of riding down the yield curve in the bond world. This effect is much more muted over longer periods of time as you have fewer investors clamoring to buy options and keeping the implied vols at their previous downside levels.
Another way to see this is by looking at the Credit Suisse Fear Barometer that measures the skew, and what many consider the market fear, in an objective way. On Friday the “Fear Barometer” actually went down from 18.64% to 17.94% while the VIX spiked almost 6 vol points or almost 24%. The 17.94% measure on the CSFB Fear Barometer means that if you sell a 3-month S&P 500 call option 10% out of the money you can afford to buy a 3-month put option that is 17.94% out of the money with the call option proceeds.


