Guest Post from Chris Vermeulen at TheGoldAndOilGuy.com
How to trade oil is not an easy thing to do in today’s headline driven market. Even the best oil analysis which may have been correct will still be wrong at times. This is due to the fact that oil has many factors which play into its price. Things likes like extreme weather conditions, geopolitical events, currency fluctuations, economic conditions and supply and demand.
During any time of the day oil traders and their oil analysis stand a good chance of having one of these factors directly affect the price of crude oil messing up their charts.
But, I am a firm believer that these factors (news events) generally fall in line with the overall larger trend of oil. So understanding how to spot trends in oil is a vital part of the equation.
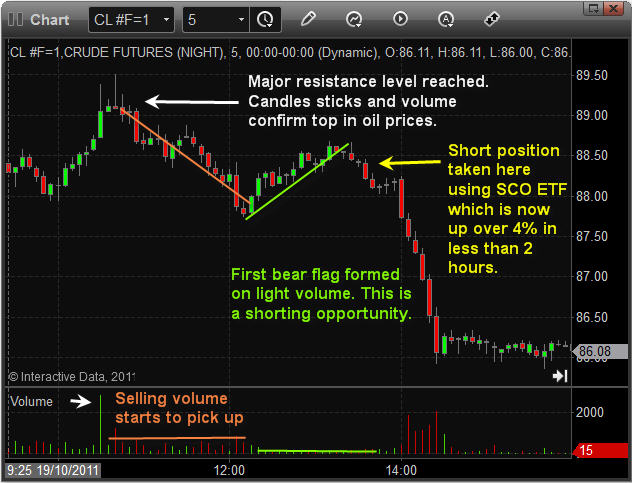
Another important aspect of trading crude oil along with stocks and commodities is for you to understanding how to trade price and volume at an intraday time frame. If you don’t understand candle sticks, chart patterns and volume will get your head handed to you more times than not.
Let’s take a look at some charts and my short video which cover everything you need to know in great detail…
How to Trade Oil Daily Chart Analysis:
Below you can see clearly how the overall trend is down for oil. You can also see the repeated bearish patterns and key resistance levels. In my oil analysis I focus on finding and trading the trend. You will not find me trying to pick a major top or bottom with my strategy; rather I focus on low risk high probability continuation patterns within a trend.
Once the trend stops and reverses there will likely be one or two losing trades as the investment shakes things up and sentiment slowly comes around and shifts to support the new trend in oil.
Intraday Crude Oil Analysis:
This is a chart of Oct 19th using a 5 minute interval. The annotations on the chart explain clearly what I saw and was hoping to see for an oil etf trade setup this week.
How To Trade Oil Conclusion:
In short, I have been waiting for this setup to unfold for a few days now. This report goes to show that if you have the patients to site back, watch and wait you will trade with much less risk. By doing this you reduce risk on your overall position because you can time your entry 1-3 days before oil moves in your favour getting you the best possible price. Also the less time you have to keep your money in a trade the better because of the factors (news events) I told you about earlier. Cash is king! Get my bi-weekly reports and videos by joining my free oil newsletter here: www.GoldAndOilGuy.com
Chris Vermeulen


