Liquidity is great…until it disappears. I have an old post out there that shows the relationship (lagged) between the steepness of the yield curve, which represents financial liquidity, and market volatility. The idea is that easy money creates a ripe environment for investments in risky assets which is supportive of equity prices and generally suppresses volatility. On the flip side, I would warn you to take a look at Japanese volatility(bottom graph) going back to when their debt bubble burst in 1990. The developed world is in a cycle of deleveraging and we should expect swings in market volatility for a long period of time.
There have been a few periods in the last couple of years when the market has baffled me. The market seems to completely ignore systemic risks for prolonged periods of time and then, out of the nowhere, it latches onto those systemic risks and enters a period of tremendous volatility and uncertainty. We saw these risk flares happen in the summer of 2010 and the summer of 2011 even though the risks were present before, during and after.
The other sad fact is that many retail investors do follow the herd. I see it in money flows all of the time. When the market is down, money flows out of equities. When the market is up, money flows into equities. We are currently in the “risk-on” period. You can definitely see that in the fact that the worst day for the S&P 500 YTD was -1.5% and the second worst day was -.69%.
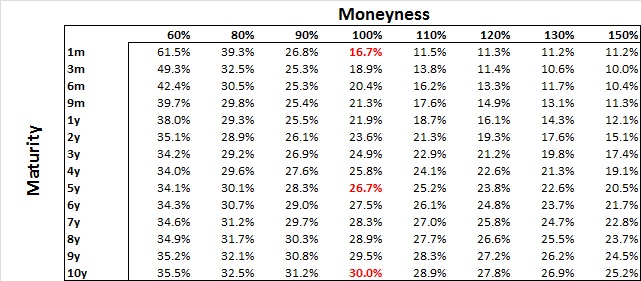
On the flip side, what is the option market showing? In the short-dated world, the VIX is showing implied volatility at a seemingly ridiculous 14.8%. That looks out a month, but what about a little further?
The above implied volatility grid comes from a big name back that trades heavily in over-the-counter S&P 500 options. These numbers match across the board. What do they tell you? That the big option traders think that one month market risk is low, 1 year market risk is low, but that there is tremendous volatility risk going out in time. Just think about what it means to pay for implied volatility at 30% for 10 years….not one year, but 10 years. To put that in perspective, the volatility between January 1, 2007 and March 13, 2012 has been 26.23%. I don’t want to trade through a 10 year period of 30%…


