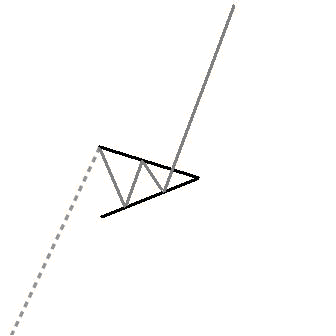
Just had a friend drop me a note questioning whether the VIX was forming a massive pennant. If you are not familiar with the technical analysis jargon, a pennant formation is represented by a quick move up followed by lower highs and higher lows. Generally as you move through the pennant you expect to see volume decrease:
If you look at the VIX, it definitely matches the description:
This same pattern can also represent a bearish case when forming an upside down pattern as so:
It just so happens that the S&P 500 is not only showing a bearish pennant formation, but a steadily decreasing level of volume…
You might think that these are all witch doctor type signals, but the fact is that many traders watch for these patterns. When enough people believe in them, they can often become self fulfilling. To the true technicians – I apologize if the the lines are not drawn perfectly….the point is only that there is a certain amount of consolidation occurring in both indexes.
On a back to reality note, this Jackson Hole meeting on Friday could be the catalyst for even more extreme volatility. Mr. Bernanke has trapped himself in a box.


