There is one graph that blatantly stands out and should make you question your own asset allocation. The graph I refer to is the ratio of the current earnings yield on the S&P 500 (Trailing 12M earnings/S&P 500 Price) divided by the current 10 year treasury yield. This monthly graph since 1962 has looked like this:
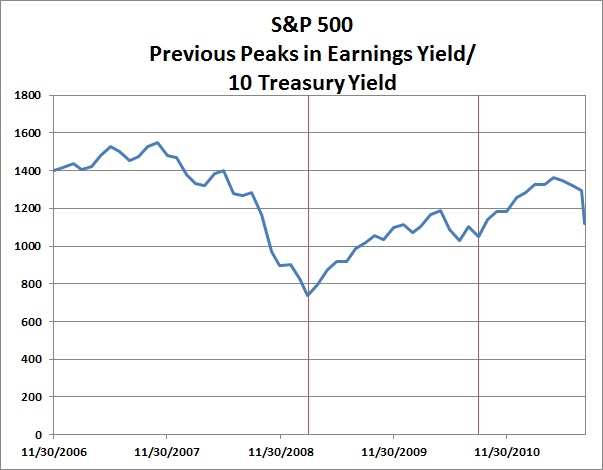
Tonight’s closing ratio of 3.86 is significantly higher than the two previous month end peaks of 3.03 on February 27th 2009 and August 31st 2010. If you cannot remember what happened after those peaks, here is a graphical reminder:
Maybe it is time to rethink your asset allocation with respect to equities versus bonds.


