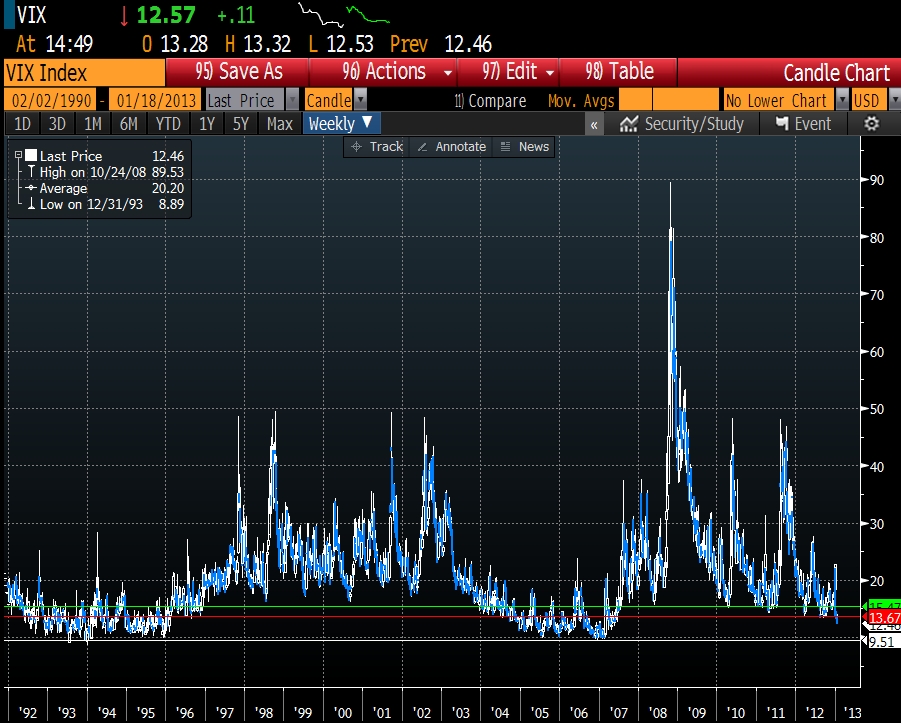
There is one truth in the market that every decent trader has to embrace: “You cannot fight the market.” No matter how strong you feelings are, you must always be able admit you are wrong and to walk away in order pull the trigger at a later date. It seemed that ~13 was a good barrier for the vix, but the market said otherwise as we crash towards all time lows:
I do have a bias that volatility will be elevated in the longer horizon due to all of the debt on developed nations’ balance sheets. Take the Japanese market as a possible indication with a 30 day realized volatility of about 22% between 1991 and 2001:
Despite my opinion, the quick and strong collapse in the VIX could indicate market sentiment that could persist in the near-term, especially with a “kick the can down the road” resolution on the debt ceiling and rather apathetic market participants in the early part of the year. With that as a backdrop, I decided to take a look at all of the prior periods in market history since the inception of the VIX that
- The VIX was below 16 and
- The VIX was trading lower than the last 20 trading days of historic volatility
The results were somewhat surprising. First, this is a rare event. This condition was met on 102 of the 5788 trading days in the test or just 1.76% of the time. Secondly, the returns in the 1, 2, and 3 months following this condition were mostly strong for the S&P 500 with an average return of 1.7%, 3.15% and 3.99% respectively:
On average the VIX modestly declined from its starting level, but the potential for strong upside was greater due to the depressed starting point.
Bottom line: history tells us it is a fairly bullish setup in early 2013.


