I learned long ago that you do not fight the tape. That’s rule #1. There are lots of anecdotes of traders who were convicted that the market in the late 1990’s was waaaaayyyyyy overbought and that the valuations were ridiculous. These traders placed shorts on the market, told their underlings that if they did not have a short trade idea they were not interested. Many of these *smart* traders went bankrupt. As we all know the market continued to run skyward regardless of what valuations were. A market only is overbought when the last chump is willing to throw his money at the ponzi scheme. You are only right if you are able to stay solvent until the market confirms that you are right.
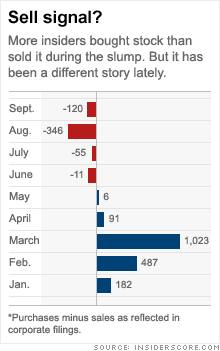
With that being said, I want to look at a few indicators from the markets that can help us get a handle on this now nearly 60% rally in equities. The first and most prominent indicator from my perspective is whether those with intimate knowledge of their companies are buying their own stock (put your money where your mouth is). CNN posted a good article showing the insider selling versus buying by aggregating some different data sources. What it tells you is that the insiders are not feeling the wind behind their backs…
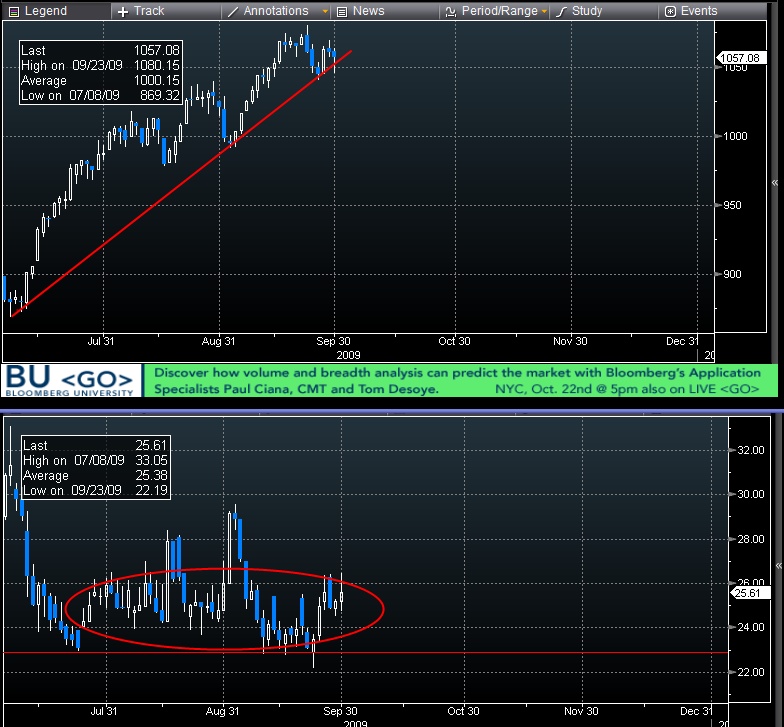
The second thing to look at is how the market is trading and what the option traders are suggesting will happen in the future. If you look at the dramatic run-up in the S&P 500 of about 25% between July 8th and September 23rd you will see that during that time implied volatility (VIX) initially sold off, but has remained flat since about the middle of July and has traded in a range between 22% and 30%. This does not mean that the market will fall dramatically, but it does mean that option traders expect volatility to come back. Volatility can only come back if the market corrects and is choppy, not if the market continues to grind higher or trade in a mild range.
The next place to look in the option market for indications is within the option volatility skew. The skew tells you at what option implied volatility an option with a strike 10% up trades versus an option with a strike 10% down.
Putting this into a more meaningful perspective, this means that traders are more willing to pay for puts 10% out of the money than they are willing to pay for calls 10% out of the money. Credit Suisse has turned this metric into a “Fear Barometer” because they believe that it captures more fully the fear in the market versus a simplied at the money implied volatility level.
The fear barometer of 17.8 means that if you sell a one month call option that is 10% out of the money, you afford to buy a put option that is 17.8% out of the money. This is just a way to translate the steepness of the skew into something more tangible. Does an 18% CSFB indicator mean that the market is definitely going to crash? Absolutely not, but it does tell you that many of the smarter investors are a little bit cautious in this rally. But always remember, do not fight the tape.


